Rhythms of Code

Motivation
As a Computer Science student, I wanted to learn about my habits. Writing code is more than just an academic activity for me, I like building software in my spare time. Over time, I've noticed that music is almost always a part of this routine. Whether it's a soothing melody or an upbeat tune, music seems to keep me company and possibly, influences my coding efficiency.
This got me thinking - does music really make a difference in my productivity? This is where this project came in, I wanted to use information I've learned and figure out if there is a relation between my sleep, music listening and coding habits.
Data Collection
The data collected can be summarized as sleep and wake times obtained from a personal diary, commit information from GitHub to quantify coding efficiency, and daily music listening information from Spotify. Keep reading to find out how I went over each of them individually.
Collecting daily sleep-wake times
Daily sleep-wake data was obtained by writing a script to parse sleep/wake times from my personal diary which I keep using Obsidian. The nice part about Obsidian is that each file is just a markdown file, so scraping the necessary part was just a simple script reading from plaintext files and parsing them. The full script can be found here. The end result's format is outlined as follows:
{
	"2023-08-19": {'sleep': '00:30:00', 'wake': '09:30:00'},
	"2023-08-20": {'sleep': '23:00:00', 'wake': '10:30:00'}
}
Collecting Github Contributions
Daily GitHub commit data was obtained using the GitHub API. The full script can be found here, but here is a quick summary of the process:
First, I read all the repo names using a personal access token and stored them as a list, then wrote a function to get all the commits for a repository given the repository name. Finally, combined these and cleaned up so that the relevant dates were collected. The end result:
{
	"2023-09-17": [
		{
			'message': 'Update README.md',
			'time':'21:56:03'
		},
		{
			'message': 'Handle toasts',
			'time': '11:44:52'
		}
	]
}
Collecting Daily Listening Information
Obtained this data by navigating to the privacy section of my Spotify account, selecting "Extended Streaming History" and requesting my data from Spotify. After a week or so of waiting for the data to be collected, I received an email stating that the data was ready to use.
I downloaded this data, processed and reduced it to only include relevant dates and songs that I listened to for longer than 10 seconds. The full script can be found here. Sample output data is shown below:
{
	'2023-08-19': [
		{
			'name': 'Feint - Snake Eyes',
			'played': '03:10.00',
			'time': '11:39:05'
		}
	]
}
Data Processing
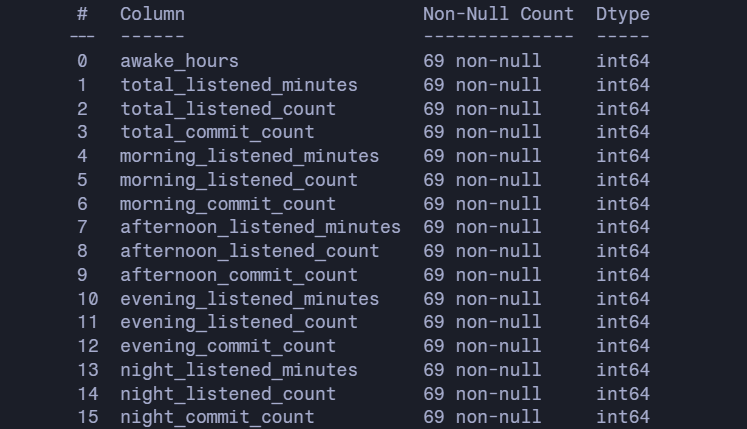
The data was processed, dates were transformed into their necessary datetime objects, commits were counted, total listened tracks and minutes were counted. The daytimes were broken down and categorized into 4 times of day in morning, afternoon, evening and night. In the end, the following dataframe was created:
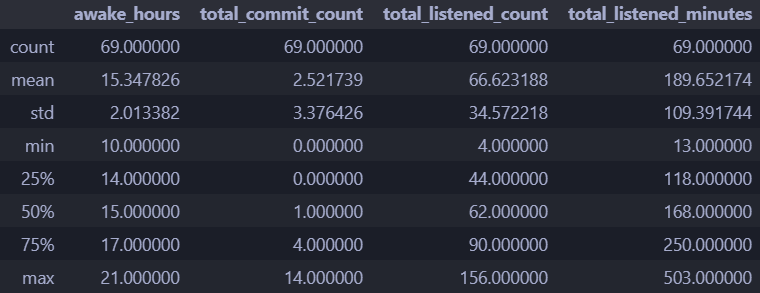
Looking at the details of the data on first glance, one interesting takeaway is a mean just shy of 15 hours of wake time, good to know. An average of 2.5 commits per day is a bit low and I would definitely like to improve that. Finally, listening to music for 3 hours per day on average is maybe a bit excessive, might need to tone that down a bit.
Check the full numeric details of the relevant parts:
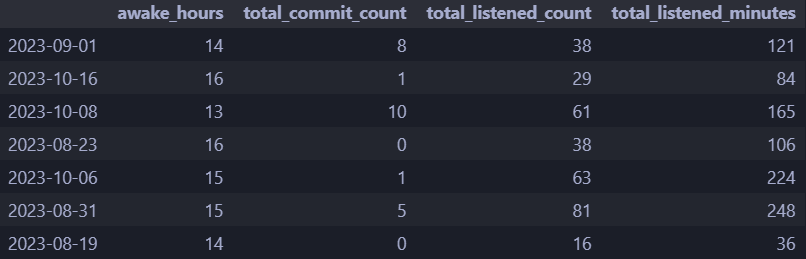
Here's a random sample from the DataFrame to put things into perspective:
Data Analysis
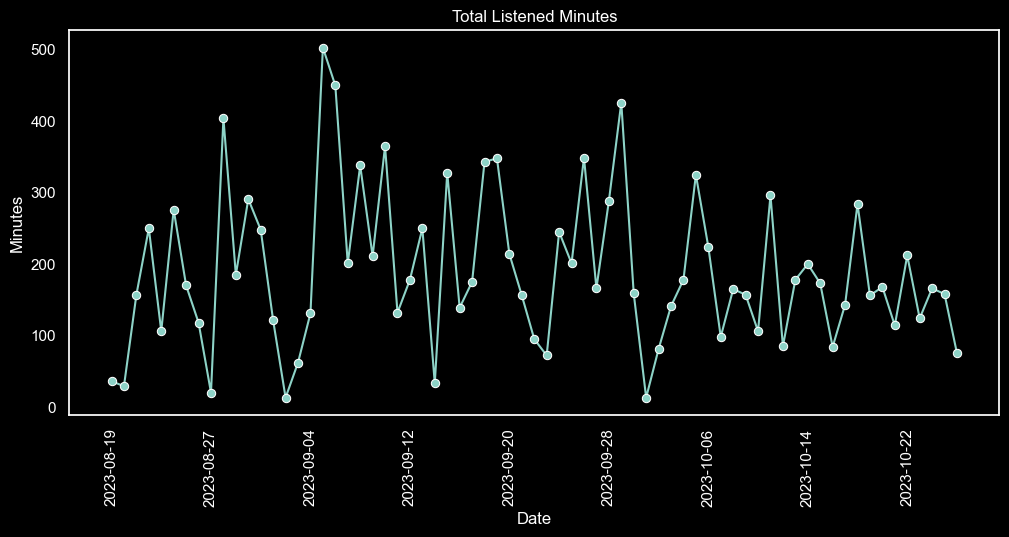
After obtaining the dataframe, I then plotted some graphs to see the data I am working with and to potentially catch any relations or correlations between commits and listening data.
Here's a graph displaying the change in total listened minutes per day:
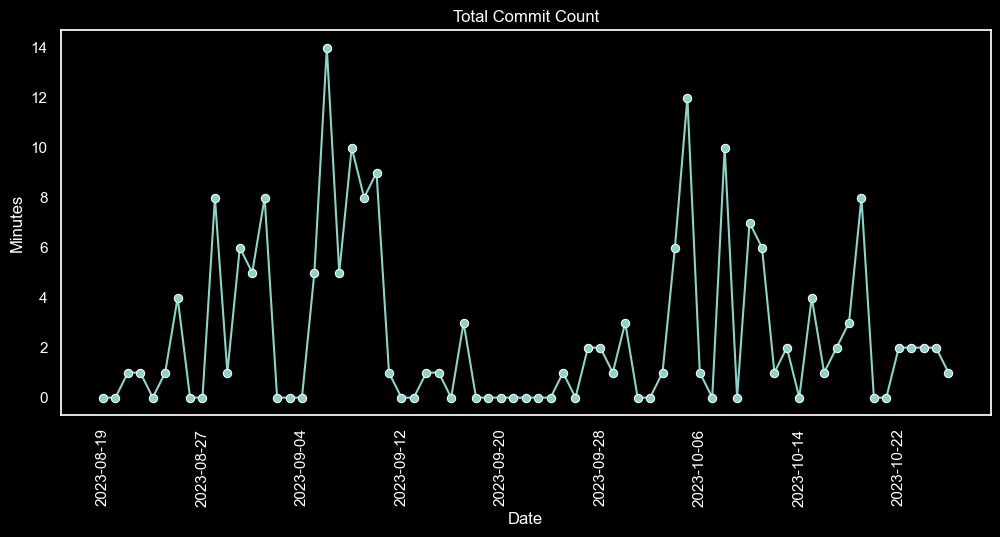
And of course, since we're comparing, we cannot leave the change in total commits per day behind:
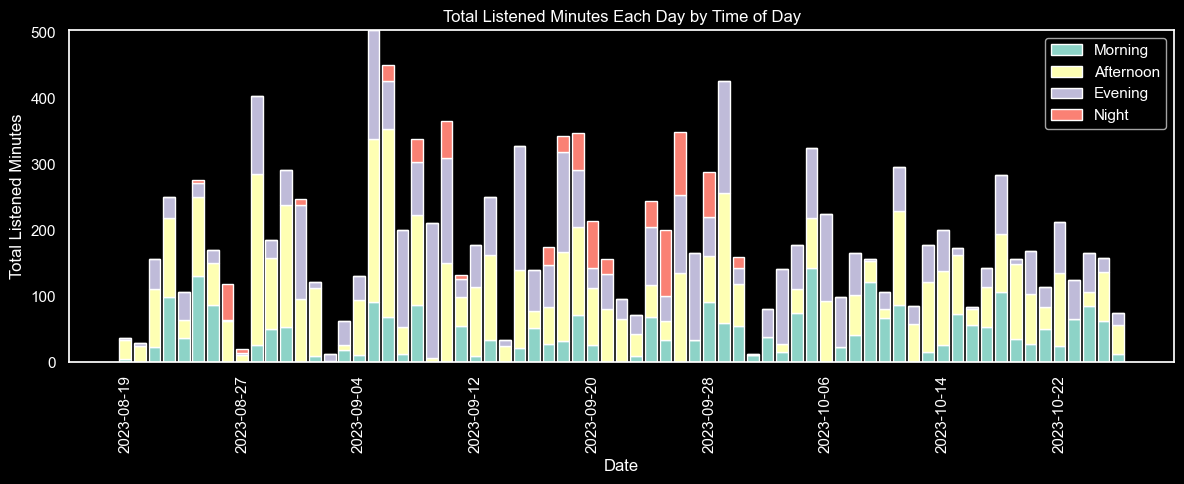
Another interesting graph regarding listened minutes, displaying the distributions of listened minutes each day depending on the time of day:
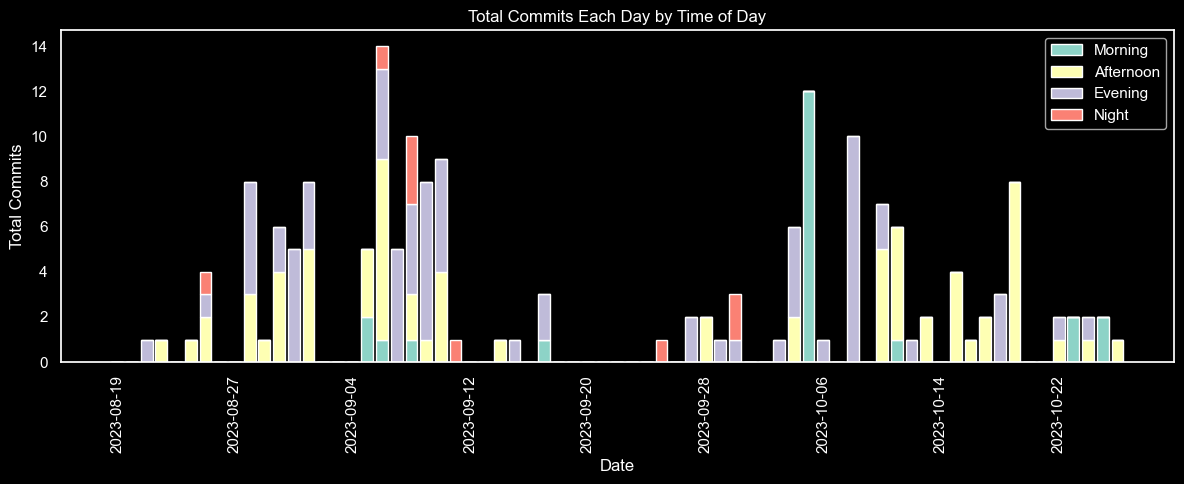
Again, for our goal's sake, we cannot forget the distributions of commits each day depending on the time of day:
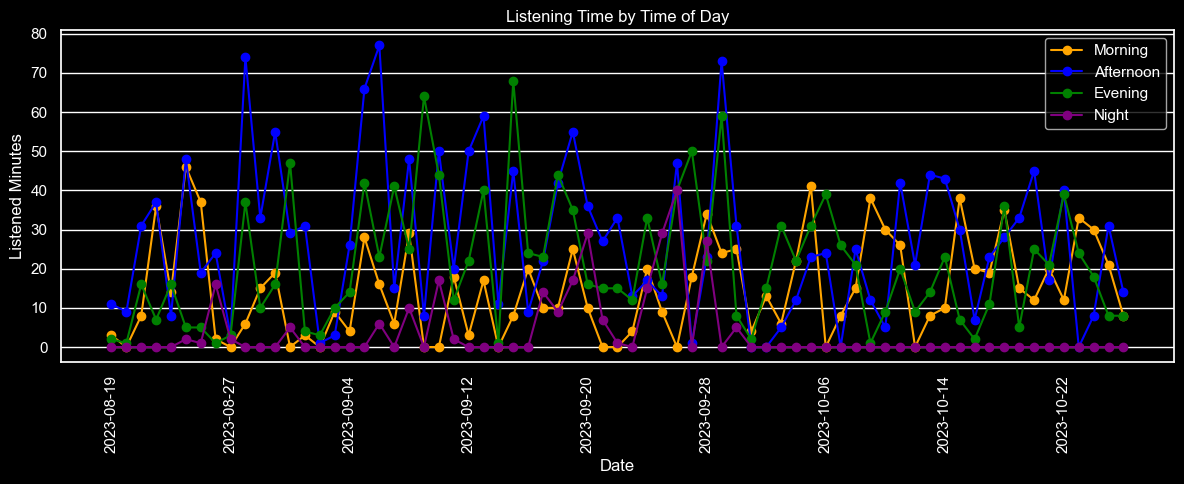
And to end this part on a high note, here is a weirdly chaotic but also somehow satisfying graph depicting the change in listened minutes per day in each time of day:
Hypothesis Testing
After visualising some data, it's finally time to test the hypothesis to see if there actually is any correlation between listening to music and coding efficiency.
First, let's compute the correlation matrix of the relevant variables and display it as a heatmap to view the degree of correlation between listened minutes, commits and awake hours:
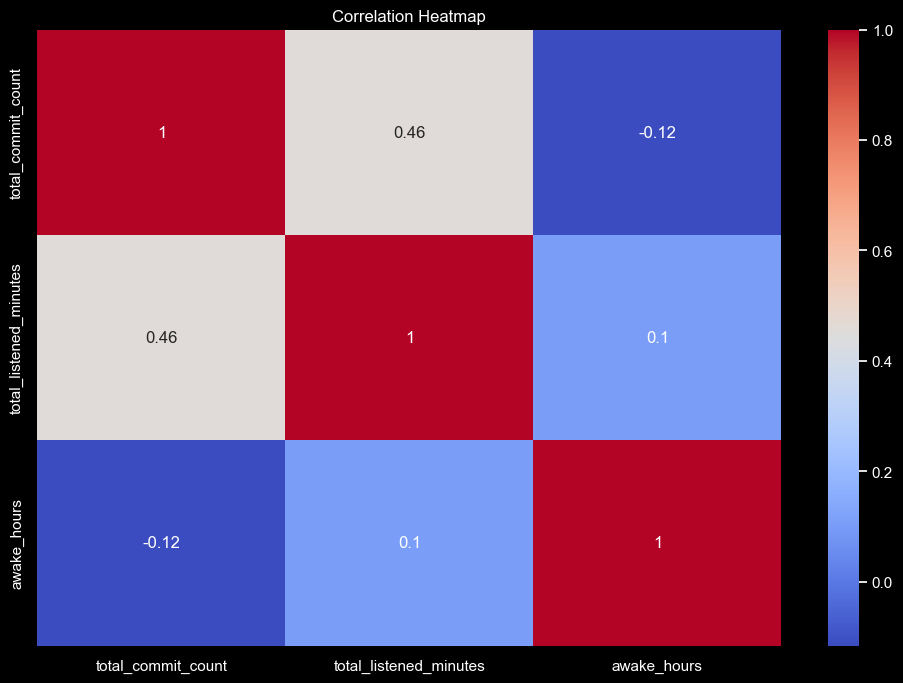
It's interesting that there seems to be, although small, negative correlation between hours awake and total commit count. This might be due to the fact that I tend to sleep less when I have more work to do, which in turn might lead to less commits. This is just a hypothesis, but it's interesting to see that there is at least some degree of correlation between the two. I'm more interested in the relationship between listened minutes and commits, so let's take a look at that:
The correlation coefficient between our two variables was calculated to be 0.46, which is a moderate correlation. This is a good sign, let's see if this is statistically significant by using some python magic:
from scipy.stats import pearsonr

# Performing Pearson correlation test
correlation_coefficient, p_value = pearsonr(df['total_listened_minutes'], df['total_commit_count'])


if p_value < 0.05:
	print(f"Correlation coefficient: {correlation_coefficient:.2f}")
	print("There is a statistically significant correlation between the total listened minutes and the total commit count.")
else:
	print("There is no statistically significant correlation between the total listened minutes and the total commit count.")

# Output:
# p_value: 0.0000845013
# correlation_coefficient: 0.46
# There is a statistically significant correlation between the total listened minutes and the total commit count.
It seems there is considerable positive correlation between the two, seems our hypothesis was not too bad. Now that we have the boring hypothesis testing section over and done with, let's have some fun.
Machine Learning
Although we have a very small dataset, let's see if we can fit this data to a linear regression model and test how well it performs and if we can predict the number of commits given the listened minutes accurately:
from sklearn.model_selection import train_test_split
from sklearn.linear_model import LinearRegression
from sklearn.metrics import mean_squared_error, r2_score
from sklearn.preprocessing import StandardScaler

# Preparing the data
X = df[['awake_hours', 'total_listened_count', 'total_listened_minutes']]  # Let's use all the available features
y = df['total_commit_count']  # Target variable

# Splitting the data into training and testing sets
X_train, X_test, y_train, y_test = train_test_split(X, y, test_size=0.2, random_state=42)

scaler = StandardScaler()
X_train = scaler.fit_transform(X_train)
X_test = scaler.transform(X_test)

# Creating the regression model
model = LinearRegression()

# Training the model
model.fit(X_train, y_train)

# Predicting the test set results
y_pred = model.predict(X_test)

# Evaluating the model
mse = mean_squared_error(y_test, y_pred)
r2 = r2_score(y_test, y_pred)

print(f"Min square error: {mse}")
print(f"R2 score: {r2}")

# Output:
# Min square error: 13.522
# R2 score: 0.3926
The result is not that great, but it gives us a general idea. Maybe in a future project I will have more data to test around with and we can then really see, trying different models does not really make sense in this regard. I think for the most part, I got what wanted.
Conclusion
This project has been a great journey for me. Taking a look into my own data, thinking about kinds of questions I could come up with regarding the data and finally, trying to answer those questions has been a great learning experience. I discovered an interesting link, the more I listened to music, the more commits I tended to make. It's a curious thing, especially since coding is not just about committing. Often, there's a lot of unseen work behind each commit. Despite this, the pattern that emerged was intriguing and spoke volumes about how music might be influencing my coding rhythm.
However, I must acknowledge that my study had its limitations. With only 69 data points, I'm just scratching the surface. In future projects, I plan to gather more data, commit more often, and maybe even explore how my typing speed plays into all this. Who knows what other insights are waiting to be uncovered?
Thank you very much for reading, I hope you enjoyed taking part in this project as much as I did. Have a great one.
- Akif